
Wearables love a tidy number. One app says your HRV looks great. Another says your sleep stages were messy. A third hands you a cheerful recovery score and acts like the case is closed. If you’ve ever wanted an HRV sleep recovery score explained without the usual gadget marketing fog, here’s the straight take: those metrics aren’t measuring the same thing, and they don’t deserve equal trust.
That matters because the reader for this stuff is usually not a 22-year-old chasing screenshots for the group chat. It’s more often a time-poor man in his 40s, 50s, or early 60s who wants to know whether today’s training session, workday, or travel schedule needs adjusting. He doesn’t need another dashboard. He needs a signal.
The best current evidence says HRV has the strongest track record as a single predictor, sleep stages are useful but messy, and composite recovery scores are convenient summaries that can hide as much as they reveal. Then there’s the part wearable companies would rather not emphasize: your own rating of how you slept may predict tomorrow’s mood better than the app does. Slightly rude, really, after all that subscription revenue.
HRV Sleep Recovery Score Explained: What Each Metric Actually Tracks
Start with the basic distinction. HRV measures variation between heartbeats, which reflects how your autonomic nervous system is balancing sympathetic stress drive against parasympathetic recovery. Sleep stages try to classify where you were in the night, usually with a mix of motion and heart-rate-derived signals. Recovery scores are composites built by each platform, which means they are partly physiology and partly product design.
That difference isn’t academic. Dial et al. in Physiological Reports published a 2025 multi-device validation study comparing popular wearables against ECG. Oura Gen 4 posted a concordance correlation coefficient of 0.99 for nocturnal HRV, the strongest result in the group. WHOOP 4.0 scored 0.94, which is still respectable but clearly lower. Garmin Fenix 6 came in at 0.87, which the paper treated as poor agreement by comparison. Same human body, three different devices, three different levels of trustworthiness.
The measurement method helps explain the gap. WHOOP captures HRV during deep sleep to reduce motion artifacts. Oura uses fingertip photoplethysmography, which tends to be a favorable location for clean pulse signals at night. Garmin is trying to do more from the wrist while also rolling those inputs into broader training and readiness products. None of that makes one company morally superior. It just means “my wearable said so” isn’t a scientific category.
So before arguing about which metric matters most, ask a simpler question: what is this number actually made of? HRV is a direct physiological signal. Sleep stages are an algorithmic interpretation. Recovery score is an editorial summary dressed up as a metric. Useful, yes. Interchangeable, no.
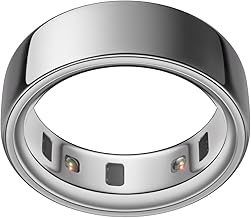
Oura Ring 4 — Silver
$349.99
This article contains affiliate links. We may earn a commission at no extra cost to you.
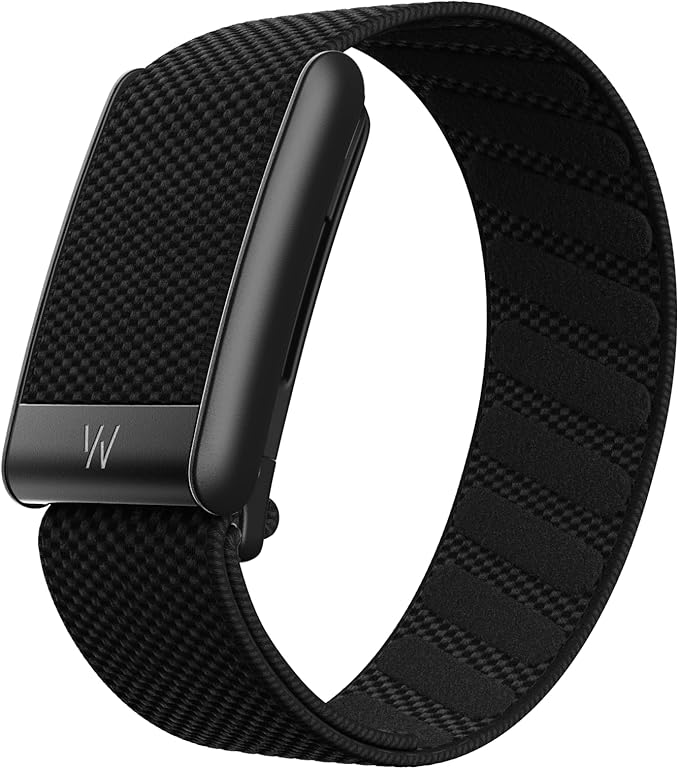
WHOOP MG Health Monitor
$239.00
This article contains affiliate links. We may earn a commission at no extra cost to you.
HRV: The Metric with the Strongest Predictive Track Record
If the goal is predicting how recovered you’ll feel tomorrow, HRV has the best independent case. A 2025 study in Frontiers in Physiology looked at 174 national-level athletes and found that pre-sleep HRV could predict chronic insomnia with 96% accuracy, with an AUC of 0.997. That’s a serious result, not wellness-app fan fiction.
The same study also found moderate predictive power for sleep efficiency, with an R-squared of 0.481, and a meaningful correlation with deep sleep time at r=0.536, p<0.001. Translation: HRV isn't a crystal ball, but it does capture something real about recovery pressure and sleep continuity. That's why coaches, sleep researchers, and better wearable platforms keep coming back to it.
It’s still easy to misuse. A single morning HRV reading is noisy. Travel, alcohol, late meals, hard training, illness, and bad sleep timing can all move it around. Treating one odd value like a verdict is how otherwise rational adults end up negotiating with their watch before coffee. The smarter move is to use HRV as a rolling trend. A suppressed seven-day pattern means more than one bad Tuesday.
A 2024 systematic review summarized in Healthcare Discovery found that multi-signal approaches can reach about 82% accuracy in detecting arousal, versus 77% for HRV alone. That’s worth knowing because it keeps the claim honest. HRV is the strongest single signal, but it isn’t the only signal that matters. Composites can add value. They just shouldn’t outrank the underlying data that makes them possible.
Sleep Stages: Why Oura, WHOOP, and Garmin Don’t Always Agree
Sleep stage charts look precise because they are colorful, segmented, and conveniently dramatic. Precision and accuracy aren’t the same thing. Consumer devices don’t measure sleep stages the way a sleep lab does. They infer them from motion, heart rate, and algorithmic modeling, then package the result in a graph clean enough to make you feel judged before sunrise.
The best recent validation results are decent, not magical. A 2024 University of Tokyo study published in Sleep Medicine compared Oura Ring Gen 3 with polysomnography across 96 participants and more than 421,000 scored epochs. Reported accuracy ranged from 75.5% for light sleep to 90.6% for REM. That’s useful directionally, especially for trends, but not clinical-grade certainty.
Brigham and Women’s Hospital reported in 2024 that Oura reached 79% agreement for four-stage classification, about 5 percentage points better than Apple Watch and 10 points better than Fitbit in that comparison. WHOOP performs very well on sleep-wake detection and sleep heart rate, with Central Queensland University reporting 99.7% agreement versus ECG for heart rate during sleep. But the same body of literature still notes room for improvement in WHOOP‘s four-stage classification.
Garmin adds another wrinkle. Its sleep staging depends on Firstbeat Analytics, and some 2025 validation work excluded Garmin data because of methodological inconsistencies. That doesn’t mean Garmin is useless. It means direct apples-to-apples comparisons are harder than marketing pages suggest.
The practical takeaway is simple: if Oura says you got 1 hour 18 minutes of deep sleep and WHOOP says 52 minutes, don’t treat that discrepancy like a medical emergency. Treat sleep stages as trend data, not as a courtroom transcript of the night.
Recovery Scores: The Convenience and the Compromise
Recovery scores exist because most people don’t want to inspect five metrics before deciding whether to push, hold steady, or back off. Fair enough. WHOOP’s Recovery Score blends HRV, resting heart rate, respiratory rate, sleep performance, and skin temperature. Oura‘s Readiness Score pulls in sleep quality, activity, resting heart rate, HRV, and temperature. Garmin Body Battery uses HRV, stress, sleep quality, and activity intensity.
That makes these scores convenient. It also makes them opaque. A 2024 systematic review on wearable recovery accuracy noted that composites can mask problems in the individual components. You can get a “green” morning score while your HRV trend is sliding the wrong way, or a middling summary score because one bad sleep-stage estimate dragged down otherwise solid physiology.
Dial et al.’s 2025 validation study matters here again. If the underlying HRV signal varies from CCC 0.99 on Oura to 0.87 on Garmin, the composite scores built on top of those inputs aren’t equivalent, even when the apps use reassuringly similar language. They are different summaries built from different sensor quality, different weighting, and different business logic.
That’s the compromise. Recovery scores save time, which is why busy people keep using them. But they also compress disagreement. When the score and your body are telling different stories, open the box. Look at HRV trend, resting heart rate, and recent sleep pattern before you let one color-coded number run the morning.
The Surprising Predictor: Your Perception May Matter More Than the Data
This is the part many wearable users resist, mostly because they paid good money not to rely on self-report. But the evidence keeps pointing in the same direction. A 2024 University of Warwick study published in Sleep Health tracked more than 100 participants over two weeks using daily sleep diaries and wrist actigraphy. Participants’ own ratings of sleep quality consistently predicted next-day positive emotions and life satisfaction. Actigraphy-derived sleep efficiency showed no association with next-day well-being at all.
That’s a sharp rebuke to the idea that the app always knows best. A 2024 systematic review in Sensors reached a similar conclusion, finding that sleep-affect associations were more robust for subjective sleep parameters than for objective actigraphic ones. In plain English: how you think you slept may tell you more about tomorrow’s mood than the device’s estimate of sleep efficiency.
This doesn’t make wearables pointless. It puts them in the right place. Your perception can be biased by expectation, stress, and mood. Device data can be limited by sensor quality and algorithm choices. When both line up, confidence goes up. When they split, the disagreement itself becomes useful.
The mistake is assuming the algorithm gets the final vote. It doesn’t. If you feel wrung out, mentally flat, or unusually irritable after a night the app scored well, that’s not weakness and it’s not user error. It’s a sign that the dashboard missed part of the story.
How to Use These Metrics Together Tomorrow Morning
The cleanest approach isn’t to pick one metric forever. It’s to give each metric the job it deserves. First, check your HRV trend over the last seven days. Not today’s isolated value. A 2025 study in Sensors found that within-person increases in HRV correlated with greater self-reported ability to meet workplace mental demands and with higher mental energy. Trend beats snapshot.
Second, compare that trend with your recovery score. If HRV, resting heart rate, and the composite score all point in the same direction, the decision is easy. Push when they are all supportive. Back off when they are all sagging. This is the rare moment when the dashboard is actually doing its job.
Third, if the score and your perception disagree, trust the disagreement enough to inspect it. Look at sleep timing, alcohol, travel, unusually hard training, late meals, and whether the sleep-stage breakdown looks plausible at all. Sometimes the score is too generous. Sometimes your mood is bad for reasons the wearable can’t measure. Either way, the answer isn’t blind obedience to the app.
Finally, keep the hierarchy straight. HRV trend is usually the most useful signal. Recovery score is a convenience layer. Sleep stages are supporting context. Your own perception is the tie-breaker that often deserves more respect than the hardware gives it.
Frequently Asked Questions
Why does my HRV sometimes say I’m recovered when I feel exhausted?
Because HRV captures one part of the recovery picture, not the whole thing. Stress, soreness, mood, poor sleep timing, or even a misleadingly favorable measurement night can leave you feeling bad despite a decent HRV reading.
Which wearable has the most accurate sleep stage tracking in 2026?
Based on the studies cited here, Oura currently has the strongest published validation for both HRV and sleep-stage performance among the major consumer devices discussed. That still doesn’t make it diagnostic-grade, and platform updates can shift the comparison over time.
Should I trust my recovery score or how I feel?
Use both, but don’t let the score overrule your own condition. When the two agree, confidence goes up. When they disagree, look at the underlying HRV trend, resting heart rate, recent sleep timing, and any obvious stressors before deciding what to do.
Can a low HRV predict illness before I feel symptoms?
It can sometimes signal that your system is under strain before you can name why, but it isn’t specific enough to diagnose illness by itself. A suppressed HRV trend is a prompt to pay attention, not a verdict.
What’s the minimum amount of deep sleep I actually need for recovery?
There is no single number that works for everyone, and wearable estimates of deep sleep aren’t precise enough to treat as a strict target. Trend, total sleep opportunity, and next-day function matter more than chasing one stage total like it’s a quarterly KPI.
The Bottom Line
If you want one signal to watch most closely, make it HRV trend. Use recovery scores for convenience, use sleep stages for context, and let your own perception keep the final vote. The goal isn’t to obey the wearable. The goal is to use it without letting a polished dashboard talk you out of what your body already knows.
Related: which wearable metrics correlate with next-day cognitive performance
Related: what your nightly recovery score actually means
Related: how Oura, WHOOP, and Garmin calculate readiness
Sources
- Dial et al. 2025. Physiological Reports. “Validation of nocturnal resting heart rate and heart rate variability in consumer wearables.” https://pmc.ncbi.nlm.nih.gov/articles/PMC12367097/
- Frontiers in Physiology. 2025. “Pre-sleep heart rate variability predicts chronic insomnia and measures of sleep continuity in national-level athletes.” https://pmc.ncbi.nlm.nih.gov/articles/PMC12488725/
- University of Tokyo / Sleep Medicine. 2024. Oura Ring Gen 3 validation summary. https://ouraring.com/blog/oura-ring-accuracy-validation-study-university-of-tokyo/
- Brigham and Women’s Hospital consumer wearable sleep-staging comparison, cited by Oura. 2024. https://ouraring.com/blog/2024-sensors-oura-ring-validation-study/
- Central Queensland University WHOOP sleep validation summary. https://askvora.com/blog/whoop-recovery-accuracy
- University of Warwick / Sleep Health. 2024. “How Our Own Sleep Ratings Shape Our Next-Day Mood.” https://neurosciencenews.com/sleep-perception-wellbeing-23756/
- Sensors. 2024. Systematic review on sleep and affect. https://www.mdpi.com/1424-8220/24/14/4701
This article is for informational purposes only and is not financial advice. Consult a qualified professional for personalized guidance.
Leave a Reply