
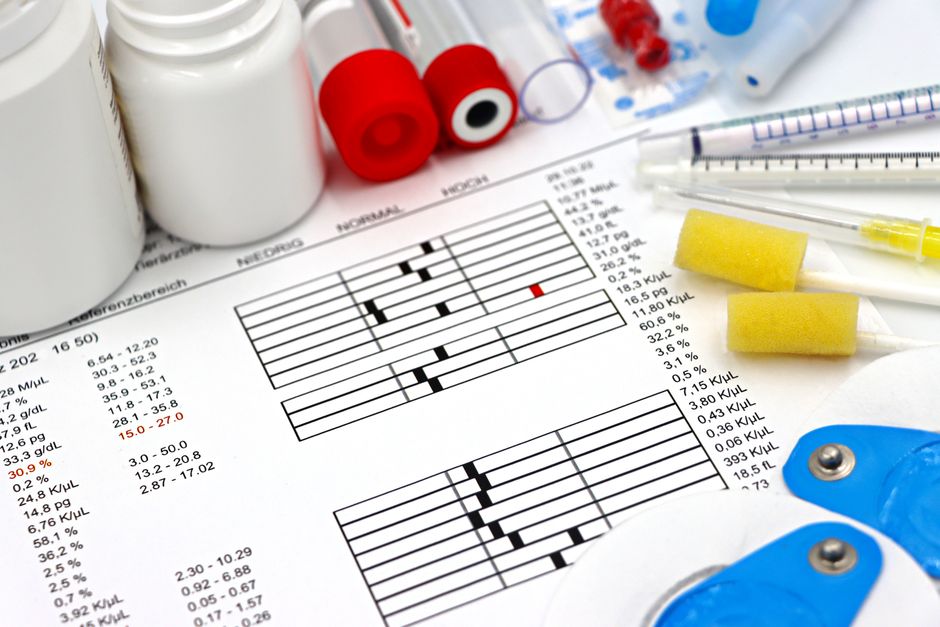
The usual annual lab routine goes like this: a doctor says your numbers are “normal,” you file the report away, and nothing useful happens until next year. That’s fine if the goal is checking a box. It’s weak if the goal is noticing where your health is actually drifting.
Biomarker trendlines annual labs tracking solves a different problem. Instead of asking whether one test result looks acceptable on one day, it asks whether the same marker is moving in the right direction across three or more years. For a 55-year-old executive who already tracks meetings, margins, and sleep debt, that is the more honest way to read health data.
The evidence points the same way. Frontiers in Genetics noted that there is no single universal biomarker of aging and that sets of biomarkers tracked over time are more useful for predicting aging-related outcomes than any one isolated reading. That matters because many lab values bounce around from day to day. A snapshot can reassure you, or spook you, for reasons that have little to do with the real pattern.
Why Biomarker Trendlines Annual Labs Tracking Beats a Single Blood Draw
A lone lab panel is a snapshot. Useful, yes. Sufficient, no.
Frontiers in Genetics reviewed the biomarker-of-aging literature and landed on the obvious conclusion that health marketers keep trying to dodge: no single magic marker explains aging well enough on its own. The better signal comes from combinations of biomarkers measured repeatedly over time. That is a polite academic way of saying one annual blood draw can tell you less than people pretend.
Day-to-day variability is part of the problem. Hydration, sleep, alcohol, a hard workout, recent illness, and even the time of day can nudge markers like glucose, hsCRP, testosterone, and triglycerides. If you only test once, you don’t know whether that number represents your baseline or a temporary wobble.
The practical mistake is treating a point-in-time result like a verdict. If fasting glucose is 98 mg/dL this year and 99 next year, that can look stable. But if fasting insulin, HbA1c, triglycerides, and waist size are all creeping up alongside it, the real story is drift. A single test can hide that drift in plain sight.
Trendlines fix the framing. Three years of repeat measurements turn “normal” into a direction-of-travel question: improving, flat, or slipping. That’s the difference between basic screening and something closer to an early-warning system.
The Six Biomarkers That Reward Year-Over-Year Tracking Most
Not every test deserves equal attention. The best longitudinal markers are the ones that change meaningfully over time and connect to outcomes you actually care about.
Start with HbA1c. In PLOS Digital Health, researchers analyzing more than 20,000 InsideTracker users followed 43 biomarkers over more than four years. Among users who started with diabetic-range HbA1c, average levels had dropped into the prediabetic range by the fifth blood draw. That kind of improvement is a trend story, not a one-year story.
ApoB belongs near the top of the list because it tracks the number of atherogenic lipoprotein particles more directly than standard LDL-C. If you need a deeper primer, Advanced Lipid Panel Men Over 50 is the right companion read.
hsCRP is worth following because inflammation is rarely interesting as a single number. Repeated results show whether you are dealing with one-off noise or a chronic low-grade pattern.
Testosterone also rewards repeat measurement, especially when symptoms and training recovery are shifting. One morning reading can be distorted by sleep, illness, recent calorie restriction, or timing. A trendline is much harder to fool.
PSA is the clearest example of why velocity matters. The Journal of Urology, using Baltimore Longitudinal Study of Aging data, found that men with annual PSA velocity above 0.35 ng/mL had 54% prostate cancer-specific survival versus 92% among men with slower rises, along with a 5.3-fold higher risk. That signal appeared 10 to 15 years before diagnosis. Absolute PSA still matters. But trend speed matters too.
Vitamin D rounds out the list because it moves with season, travel, supplement use, and sun exposure. If you only test it once, you can mistake a summer bump for a stable baseline.
Reference Range vs. Optimal Range: Why the Trendline Matters More Than the Point
Reference ranges are statistical buckets. They are not performance targets.
That distinction gets lost constantly. Standard lab reference ranges usually reflect where 95% of a population falls, including plenty of people who are technically not sick yet but are hardly operating at their best. SiPhox Health, OptimalDX, and Rupa Health all make the same broad point: the “normal” range is often much wider than the range associated with better cardiometabolic and longevity outcomes.
That is why a result can sit comfortably inside the lab’s green zone and still deserve attention. HbA1c below 5.7% is commonly labeled normal, but many longevity-focused clinicians use a tighter target below 5.4%. ApoB below 90 mg/dL for primary prevention is more demanding than the usual shrug attached to standard cholesterol panels. The same logic applies to hsCRP below 1.0 mg/L, fasting insulin below 7 uIU/mL, triglycerides below 100 mg/dL, GGT below 20 U/L, homocysteine below 7 umol/L, total testosterone above 600 ng/dL, and vitamin D around 50 to 80 ng/mL.
The point is not that everyone needs elite-athlete lab values. The point is that a drift toward worse numbers still matters before a result crosses a lab flag.
This is also why Fasting Insulin vs HbA1c vs CGM is a useful framework. These tools are complementary. A trendline lets you see whether one marker is lagging, another is leading, and whether the overall picture is improving or quietly heading the wrong way.
How to Build Your Own Biomarker Trendline Dashboard
You do not need an expensive software stack to do this well. You need consistency.
The cleanest setup is three annual draws using the same lab, at roughly the same time of year, under similar conditions. Morning, fasted, and before a hard workout is a sensible default. Quest and LabCorp are fine. A direct-access lab service is fine. What matters is reducing avoidable noise.
Track eight to ten priority markers first: HbA1c, fasting glucose, ApoB or LDL-C, triglycerides, hsCRP, vitamin D, total testosterone, PSA if age-appropriate, and fasting insulin if you can get it. Add blood pressure, waist size, weight, and resting heart rate if you want the dashboard to reflect more than lab work alone.
The spreadsheet itself can stay simple: one row per year, one column per marker, plus a column for year-over-year percentage change. Add a note field for anything that could distort the result, such as illness, poor sleep, new medication, or a cutting phase. That note column saves a lot of fake detective work later.
If you want a platform to do more of the organizing, the market is getting better. Sacra reports that Function Health, priced at $365 per year, has run more than 50 million lab tests since 2023 and offers 160-plus biomarkers with twice-yearly retesting. InsideTracker recommends retesting every three to six months for users who want tighter feedback loops. That’s more frequent than most people need, but it shows how the category is thinking.
For readers comparing consumer platforms, SiPhox vs LetsGetChecked vs InsideTracker 2026 Comparison can help narrow the options. The right answer is usually the one you’ll actually repeat, not the one with the flashiest dashboard.
What a Three-Year Trendline Catches That a Single Lab Misses
This is where the method earns its keep.
A three-year trendline catches rate of change. One year’s HbA1c of 5.5% may not trigger concern. But 5.1%, then 5.3%, then 5.5% tells a different story. You are not looking at a number. You are looking at direction.
The PLOS Digital Health cohort makes that concrete. Repeated blood draws showed sustained improvements across several biomarkers over more than four years, including HbA1c moving from diabetic into prediabetic territory among higher-risk users. A single annual snapshot would never show whether that person was recovering ground or losing it.
PSA velocity is even more blunt. The Journal of Urology data showed that an annual increase above 0.35 ng/mL carried a much higher long-term risk even after accounting for absolute PSA level. A man can have a PSA that still looks acceptable on paper while the rate of rise is quietly waving a red flag.
Variability matters too. Frontiers in Endocrinology reported that HbA1c variability, measured by metrics like standard deviation and coefficient of variation, was independently associated with cardiovascular risk beyond average HbA1c alone. Translation: two people can share the same mean value while one of them is metabolically less stable.
That is the real upgrade here. Trendlines reveal momentum, volatility, and timing. A one-off lab mostly reveals what happened on lab day.
The Platforms Making Longitudinal Tracking Practical Right Now
The good news is that this no longer requires a concierge clinic and a binder full of paper results.
InsideTracker has built its model around longitudinal use, layering blood biomarkers with wearable data and recommendations informed by thousands of studies. Function Health has gone broader with a high-biomarker-count membership model and, through its Ezra deal, an expanding imaging angle. Forbes reported that Function Health is pushing hard on the idea that consumers will manage health data more like a recurring analytics product than a once-a-year doctor visit.
Direct-access lab services remain the most flexible budget option. Personalabs, Marek Health, and Jason Health let users order panels without the traditional scheduling circus, and comprehensive panels often land in roughly the $200 to $600 range depending on how much you add.
None of these platforms replaces judgment. If your priority is building a usable three-year record, the best platform is the one that delivers repeatable tests, clean exports, and enough consistency that you can compare year one to year three without a spreadsheet migraine.
Frequently Asked Questions
How many years of lab data do I need before a trendline becomes meaningful?
Three annual data points is the practical minimum. Two points show change, but three points show whether that change is a one-off jump or the start of a pattern.
Should I use the same lab every year, or does it not matter as long as the test is the same?
Use the same lab when possible. Different labs, assay methods, and reporting practices can create small differences that make trend interpretation messier than it needs to be.
Can I build a trendline from past lab reports I already have, or do I have to start from scratch?
You can absolutely backfill older reports. Just note where the testing context changed, especially if one year was non-fasted, done at a different lab, or measured after medication changes.
What if my doctor says my labs are normal for your age but I feel worse than five years ago?
That is exactly when trendlines help. “Normal for your age” can hide gradual decline. A documented shift in testosterone, hsCRP, HbA1c, ApoB, or fasting insulin gives you a clearer basis for a better conversation.
Do fitness trackers like WHOOP or Oura provide any useful trend data alongside annual bloodwork?
Yes, if you treat them as supporting context rather than a substitute for blood work. Resting heart rate, HRV, sleep consistency, and recovery trends can help explain why a lab marker moved.
The Bottom Line
Annual labs are better than nothing, but single-year readings are a weak way to manage long-term health. Three years of repeat testing turns routine blood work into a dashboard that can catch drift earlier, separate noise from pattern, and make the next doctor’s visit a lot more useful.
Sources
- Frontiers in Genetics. “Ranking Biomarkers of Aging by Citation Profiling and Effort Scoring.” https://pmc.ncbi.nlm.nih.gov/articles/PMC8176216/
- PLOS Digital Health. “Improvements in Blood and Fitness Tracker Biomarkers in a Longitudinal Real-World Cohort of Digital Health Platform Users.” https://journals.plos.org/digitalhealth/article?id=10.1371/journal.pdig.0001271
- SiPhox Health. “What’s the Difference Between Normal and Optimal Blood Ranges?” https://siphoxhealth.com/articles/whats-the-difference-between-normal-and-optimal-blood-ranges
- OptimalDX. “Optimal Range.” https://www.optimaldx.com/optimal-range
- Journal of Urology. “PSA Velocity Predicts the Risk of Prostate Cancer Death After Accounting for Known Factors.” https://pmc.ncbi.nlm.nih.gov/articles/PMC3922327/
- Sacra. “Function Health — Product Breakdown.” https://sacra.com/c/function-health/
- Cleveland Clinic. “Health Maintenance Guidelines for Adults.” https://my.clevelandclinic.org/-/scassets/files/org/patients-visitors/information/health-maintenance-guidelines-for-adults.pdf
- Frontiers in Endocrinology. “HbA1c Variability and Cardiovascular Risk in Type 2 Diabetes: A Systematic Review and Meta-Analysis.” https://www.frontiersin.org/journals/endocrinology/articles/10.3389/fendo.2025.1698360/full
- Forbes. “Function Health’s $2.5 Billion Bet.” https://www.forbes.com/sites/josipamajic/2025/11/26/function-healths-25-billion-bet-and-are-blood-testing-startups-sustainable/
Continue reading: Read the pillar — Biomarkers & Lab Testing
This article is for informational purposes only and is not financial advice. Consult a qualified professional for personalized guidance.
Leave a Reply