
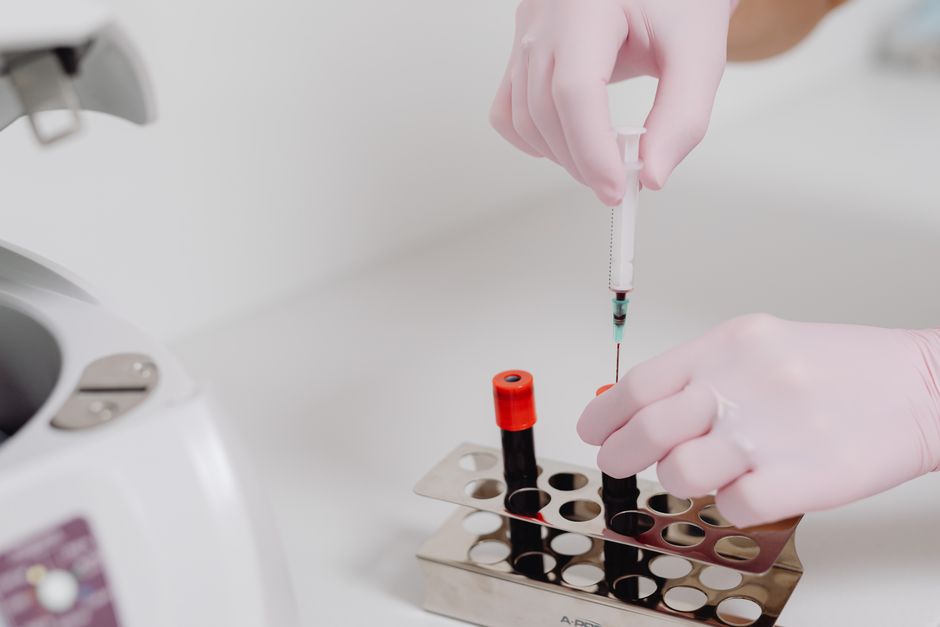
Most men do not need more lab work. They need a better way to read the labs they already have.
That is the real gap. A standard blood panel lands in the portal, a few numbers are bolded in red, and the official summary is usually some version of “normal for your age.” Meanwhile, energy is worse, recovery is slower, sleep is lighter, and the edge that used to show up on command now feels negotiable. That disconnect is exactly why learning how to interpret blood work for men over 50 matters. The numbers often tell a cleaner story than the five-minute follow-up visit.
Lab data already shapes most clinical decision-making. Mayo Clinic Laboratories says laboratory results influence roughly 60 to 70 percent of medical decisions, which is another way of saying these numbers are not background noise. They are the dashboard. The trick is knowing which gauges matter, what counts as a true red flag, and when a “normal” range is doing you no favors.
How to Interpret Blood Work for Men Over 50 and Why It Matters After 50
After 50, the margin for ignoring drift gets smaller. Blood pressure climbs, insulin sensitivity can soften, testosterone may slide, and liver markers can start reflecting the accumulated cost of alcohol, extra body fat, poor sleep, or medications. The CDC reports that 55.9 percent of men ages 40 to 59 have hypertension. The HIM Study, published in the International Journal of Clinical Practice, found low testosterone below 300 ng/dL in 38.7 percent of men age 45 and older. None of that means every off day is a disease. It means the “I guess this is aging” story is often too lazy.
This is where blood work earns its keep. It gives you objective markers for systems that tend to decline quietly before they fail loudly: glucose regulation, liver function, kidney function, inflammation, red blood cell status, and hormone balance. If you are a 55-year-old executive, former athlete, or just a man who notices he does not bounce back the way he used to, a good panel can separate vague frustration from an actual pattern.
The useful mindset is simple: do not stare at the report looking for a single heroic number that explains your life. Read for clusters. Low energy plus borderline anemia markers is one story. Low energy plus elevated A1c plus low testosterone is another. Rising ALT plus higher triglycerides plus a thicker waistline tells its own story too. A lab report is less like a verdict and more like an instrument panel. One blinking light matters. Three blinking lights matter more.
The Complete Blood Count: Your First Window Into Overall Health
The CBC is the least glamorous panel in the packet and one of the most useful. It measures red blood cells, hemoglobin, hematocrit, white blood cells, and platelets. Cleveland Clinic lists common adult male reference ranges around 4.5 to 6.2 million red blood cells per cubic millimeter, hemoglobin at 13.2 to 17.7 g/dL, hematocrit at 40 to 52 percent, white blood cells at 3.7 to 10.5 thousand per cubic millimeter, and platelets at 150 to 400 thousand per cubic millimeter.
Start with the red-cell side of the page. Red blood cells, hemoglobin, and hematocrit all help answer one blunt question: are you carrying oxygen efficiently or not. If hemoglobin is low, anemia moves onto the table. That can reflect iron deficiency, low B12, chronic disease, blood loss, or occasionally something more structural. Men over 50 do not get to shrug off unexplained anemia as a rough month. It deserves follow-up because it can point to gastrointestinal bleeding, medication effects, or nutritional issues that are fixable if caught early.
Next, scan white blood cells. A high WBC can signal infection, inflammation, steroid use, smoking, or sometimes stress physiology. A low WBC can show up with viral illness, marrow suppression, or certain medications. On its own, one modestly abnormal value is not a movie soundtrack moment. In context, it matters. If WBC is elevated and hsCRP is elevated and you feel run down, that is a different picture than an isolated one-point bump after a bad week of sleep.
Platelets are the other overlooked clue. Too low can raise bleeding concerns. Too high can point to inflammation, iron deficiency, or reactive changes after illness. Again, the point is not self-diagnosis from the kitchen table. The point is that the CBC often tells you whether you are looking at oxygen delivery, immune activity, clotting dynamics, or nothing meaningful at all.
If there is one practical rule here, it is this: do not read a CBC as five separate trivia questions. Read it as one system. Low hemoglobin plus low hematocrit plus low RBC is a coherent pattern. So is elevated WBC plus elevated platelets during an inflammatory state. Pattern recognition beats random panic every time.
What Your Comprehensive Metabolic Panel Reveals About Your Liver, Kidneys, and Metabolism
The CMP is the broad housekeeping panel. UCSF Health notes that it includes 14 biomarkers spanning glucose, electrolytes, kidney function, liver enzymes, and proteins. This is where a lot of early wear and tear shows up before anybody uses the word disease.
Glucose is the obvious starting point. A normal fasting glucose is often listed around 70 to 100 mg/dL. If yours is consistently nudging above that, do not congratulate yourself because it is not yet disastrous. Glucose drift is the sort of thing that often looks politely “fine” right up until it is not. One slightly high result is not enough to conclude much, but repeated upward movement deserves attention, especially when paired with rising triglycerides or HbA1c.
Now look at kidney markers: creatinine and BUN. Creatinine commonly sits around 0.6 to 1.3 mg/dL, while BUN often falls around 6 to 20 mg/dL. High creatinine can suggest impaired kidney function, but context matters. A muscular man can run a higher creatinine than a sedentary peer and still be okay. Dehydration can also distort the picture. This is why trends beat one-off interpretations. A stable creatinine of 1.2 is different from a climb from 0.9 to 1.2 over a year.
Liver enzymes are where plenty of men get their first unpleasantly useful clue. ALT is often listed around 4 to 36 U/L and AST around 8 to 33 U/L. Elevated numbers can reflect alcohol use, medication effects, hard training, viral illness, or fatty liver disease. The NIH has estimated nonalcoholic fatty liver disease affects about one-quarter of U.S. adults. That is a big reason not to wave off mild enzyme elevations as random static. In a lot of men, the liver sends the first memo long before symptoms show up.
Electrolytes and proteins matter too, even if they are not the sexy part of the report. Sodium, potassium, chloride, carbon dioxide, albumin, and total protein help frame hydration status, acid-base balance, and protein production. They are not usually the lead actors, but they can change the interpretation of everything around them.
The best way to read a CMP is by asking three questions. Is blood sugar control drifting. Are the kidneys filtering normally. Is the liver quietly complaining. If you can answer those three, you are already getting more value from the panel than most people who just scan for red font.
Decoding Your Lipid Panel: LDL, HDL, Triglycerides, and the Ratios That Matter
The lipid panel is where simplistic thinking goes to cause trouble. Too many men still treat it as a single-number exam where LDL alone decides whether things are fine. That is convenient. It is also incomplete.
Cleveland Clinic lists broad targets many readers will recognize: total cholesterol under 200 mg/dL, LDL under 100 mg/dL for most people and under 70 mg/dL for higher-risk patients, HDL roughly 40 to 80 mg/dL for men, and triglycerides under 150 mg/dL. Those ranges are useful. They are not the whole picture.
Start with LDL because it still matters. High LDL means more circulating cholesterol carried in particles that can contribute to plaque formation. But LDL without context is like checking the weather by reading only the humidity. It gives you something, not enough.
Now bring in HDL and triglycerides. HDL is often described as the protective side of the panel, though it is better treated as one marker among many than a superhero. Triglycerides often reflect metabolic health more directly than people realize. High triglycerides can travel with insulin resistance, excess alcohol intake, poorly controlled carbohydrate intake, or weight gain around the middle. If LDL is fine but triglycerides are 220 and fasting glucose is creeping up, that is not a clean bill of health. That is metabolic drift in a better suit.
Non-HDL cholesterol is worth more attention than it gets. Yale Medicine notes it can be a better cardiovascular risk predictor than LDL alone because it captures all the potentially atherogenic cholesterol fractions, not just the headline number. This matters for the man whose LDL looks respectable while the rest of the panel says otherwise.
If you want one practical reading sequence, use this: LDL first, triglycerides second, HDL third, non-HDL as the cross-check. Then compare the whole panel with waistline, blood pressure, glucose, and training status. Lipids are not a morality test. They are a traffic report.
An advanced lipid panel can make sense when the standard panel is ambiguous, family history is strong, or risk looks higher than the standard report suggests. It is not mandatory for everyone. But if your standard lipids say one thing and your broader risk profile says another, that is the moment to ask better questions instead of pretending the spreadsheet settled it.
Beyond the Standard Panel: Testosterone, A1c, and hsCRP
This is the section many men care about most, usually because it contains the numbers tied to energy, body composition, cardiovascular risk, and the creeping feeling that the engine is no longer hitting the same RPM.
Start with testosterone. The HIM Study found low testosterone in 38.7 percent of men over 45, which helps explain why the subject keeps coming up in locker rooms, group chats, and overly aggressive clinic ads. But the smart read is not “low energy equals TRT.” The smart read is “symptoms plus labs plus context.” Total testosterone, free testosterone if ordered, SHBG if available, sleep quality, body fat, medication use, alcohol intake, and training load all shape the real picture. Anyone considering TRT should consult their provider and run labs before starting, because testosterone therapy can change hematocrit, lipids, fertility, and how other symptoms are interpreted. This is one area where bravado is expensive.
Next is HbA1c, the three-month average of blood sugar exposure. The American Diabetes Association recommends screening beginning at age 45, and that is sensible. A fasting glucose can look acceptable on a given morning. HbA1c is harder to sweet-talk. If fasting glucose is the snapshot, A1c is the quarterly earnings report. Not thrilling, but harder to fake. When A1c drifts up, it often shows insulin resistance or glucose mismanagement before a standard CMP result looks dramatic.
Then there is hsCRP, a marker of systemic inflammation. Standard lab reports may show values under 1.0 mg/L as normal, but some functional and preventive frameworks push for tighter targets. Optimal DX cites less than 0.55 mg/L as a more ambitious benchmark for men. That does not mean every man at 0.8 has a crisis on his hands. It means that “within range” and “ideal for long-term cardiometabolic health” are not always the same sentence.
These three markers matter because they often fill the gaps left by a standard annual panel. Testosterone speaks to hormonal status. A1c captures glucose trends that a single fasting draw can miss. hsCRP adds inflammation, which can connect dots between sleep, body composition, cardiovascular risk, and recovery. None of them should be read in isolation. Together, they give a much better read on how the body is aging under the hood.
Reference Ranges vs. Optimal Ranges: Why Normal for Your Age Is Not a Clean Bill of Health
Here is the uncomfortable truth about reference ranges: they are built to describe the middle 95 percent of the tested population, not the healthiest 5 percent of men who still feel sharp at 58. That is useful for spotting clear pathology. It is less useful for catching slow decline before it becomes obvious.
This is why the phrase “normal for your age” can be technically true and practically unhelpful. A man can fall inside standard range for hsCRP, vitamin D, TSH, or fasting insulin and still not be anywhere close to optimal metabolic function. Standard ranges are population tools. They are not performance tools.
Take hsCRP first. One lab may mark anything under 1.0 mg/L as acceptable. A more aggressive performance-minded interpretation might prefer something closer to 0.55 mg/L. That difference matters because inflammation often shows up as a background problem long before it becomes a named diagnosis.
Vitamin D is another example. Some standard reports treat 30 ng/mL as acceptable, while more aggressive preventive frameworks often want 50 to 80 ng/mL. TSH is similar. A reference range may stretch from 0.4 to 4.5 mIU/L, but some clinicians and endocrine-oriented frameworks get more interested when patients are sitting in the upper part of that range with symptoms. Fasting insulin is the quiet trapdoor here. Standard ranges can extend well above what many cardiometabolic specialists would consider reassuring.
This does not mean every standard range is wrong or that every optimal range promoted online is worth trusting. Plenty of functional-medicine marketing turns “optimal” into a revenue model. The useful takeaway is narrower. If you feel worse, perform worse, and recover worse than you did five years ago, a technically normal result should end the conversation less often than it currently does.
Think of reference range as the floor for obvious trouble, not the ceiling for excellent health. That is a less comforting line than most patients get. It is also closer to reality.
How to Build Your Own Longitudinal Lab Tracking System
One panel is a snapshot. Five panels over five years are a trend line. That simple difference is where most of the value lives.
The body rarely falls apart in one dramatic chart movement. More often, glucose drifts from the mid-80s into the high-90s. HbA1c slides from 5.2 to 5.6. ALT creeps up. Testosterone trends lower. hsCRP inches higher. Every single result remains explainable on its own. Put them together over time and the pattern gets obvious.
That is why a personal lab log is worth building. Use a spreadsheet, notes app, or anything else you will actually maintain. Track the date, fasting status, body weight, sleep quality the night before, current medications or supplements, and the main markers that matter for your situation. For many men over 50, that short list includes fasting glucose, HbA1c, LDL, triglycerides, ALT, creatinine, testosterone, and hsCRP.
Consistency matters more than software. Try to test under roughly similar conditions each time. If one draw is fully fasted after eight hours of sleep and the next happens after a steak dinner and four hours in a hotel bed, the comparison gets noisy. Still usable, just noisier.
The practical benefit is early detection. Trend tracking can catch the first signs of insulin resistance, fatty liver drift, worsening recovery, or inflammation before a single number finally pops outside the lab range and earns everybody’s attention. That is not a published law of physics. It is the basic advantage of repeated measurement over isolated snapshots, and it is exactly how a good operator reads any system that matters.
A simple rule helps here: do not obsess over every decimal point. Flag direction, speed, and clustering. Up a little once is often noise. Up a little three times in a row is a pattern. That is when the conversation with your provider gets sharper, because you are no longer saying “I feel off.” You are saying “fasting glucose rose 11 points in 18 months while triglycerides climbed and A1c moved from 5.2 to 5.6.” Doctors tend to hear that more clearly, and frankly, so should you.
Frequently Asked Questions
My doctor says my labs are normal for my age, but I do not feel the way I did five years ago. What should I ask at my next appointment?
Ask which markers were reviewed in context rather than one by one. A useful follow-up is whether trends in testosterone, A1c, triglycerides, hsCRP, liver enzymes, and thyroid markers could explain the symptoms. “Normal for your age” is not a diagnosis. It is a starting point for a better question.
How often should a man over 50 get comprehensive blood work?
That depends on baseline health, medications, family history, and whether something is already being monitored. For many men, annual labs are the minimum useful cadence. If you are adjusting treatment, watching glucose drift, evaluating testosterone, or following elevated liver enzymes, your provider may want a shorter interval.
Can I order my own blood work without a doctor’s referral?
In many states, yes, through direct-to-consumer lab services. The convenience is real, but the limitation is also real: ordering a panel is easier than interpreting it well. If results are abnormal, symptoms are significant, or you are considering TRT or medication changes, consult your provider rather than trying to play physician with a PDF.
What is the difference between a standard lipid panel and an advanced lipid panel?
A standard panel covers total cholesterol, LDL, HDL, and triglycerides. An advanced panel may add ApoB, lipoprotein(a), particle counts, or particle size data. The standard panel is enough for plenty of people. Advanced testing earns its keep when family history, metabolic risk, or mixed signals make the standard numbers look too tidy.
Do I need to fast before blood work, or has that guidance changed?
It depends on the panel and your provider’s goal. Some lipid testing can still be informative without fasting, but fasting often improves comparability when you are tracking triglycerides, glucose, or insulin-related markers over time. The bigger point is consistency. However you test, try to keep the setup similar from draw to draw.
Blood work is not magic. It is a measurement system. Men over 50 who learn to read it well stop outsourcing the entire story to a portal summary and start seeing patterns sooner. That alone can lead to better questions, better follow-up, and fewer years spent being told everything looks fine while performance quietly slides.
Sources
- Mayo Clinic Laboratories. “4 Statistics That Showcase the Broad Impact of Laboratory Medicine.” 2025. https://news.mayocliniclabs.com/2025/04/21/4-statistics-that-showcase-the-broad-impact-of-laboratory-medicine/
- CDC / NCHS. “Total and High-Density Lipoprotein Cholesterol in Adults: United States, August 2021-August 2023.” 2024. https://www.cdc.gov/nchs/products/databriefs/db515.htm
- International Journal of Clinical Practice / PubMed Central. “Prevalence of Hypogonadism in Males Aged at Least 45 Years: The HIM Study.” 2006. https://pmc.ncbi.nlm.nih.gov/articles/PMC1569444/
- Cleveland Clinic. “Complete Blood Count: What It Is and Normal Ranges.” 2024. https://my.clevelandclinic.org/health/diagnostics/4053-complete-blood-count
- UCSF Health. “Comprehensive metabolic panel.” 2024. https://www.ucsfhealth.org/care/medical-tests/comprehensive-metabolic-panel
- PubMed Central / NIH. “The Impact of Laboratory Testing in Clinical Decisions.” 2024. https://pmc.ncbi.nlm.nih.gov/articles/PMC10857549/
- Cleveland Clinic. “Cholesterol: Understanding Levels and Numbers.” 2024. https://my.clevelandclinic.org/health/articles/11920-cholesterol-numbers-what-do-they-mean
- American Diabetes Association. “Understanding A1C.” 2024. https://diabetes.org/about-diabetes/a1c
- Optimal DX. “Biomarkers of Inflammation: High-Sensitivity CRP.” 2024. https://www.optimaldx.com/research-blog/biomarkers-of-inflammation-hs-crp
Continue reading: Read the pillar — Biomarkers & Lab Testing
This article is for informational purposes only and is not financial advice. Consult a qualified professional for personalized guidance.
Leave a Reply