

Most men over 50 get handed a lab report, hear the word “normal,” and go home with exactly the same question they started with: then why do I feel worse than I did five years ago?
That’s the gap this article is here to close. If you want to know how to read bloodwork for men over 50, the useful question isn’t whether a number barely cleared a lab cutoff. The useful question is what that number says about energy, recovery, cardiovascular risk, metabolic health, and whether your body is quietly making your life harder.
Standard lab reports are built to detect obvious disease, not to explain why a high-functioning 55-year-old feels flatter in the gym, slower in meetings, or more inflamed than his habits should justify. That difference matters. The lab sheet looks objective. Sometimes it’s just polite.
Five markers do a lot of the heavy lifting here: total testosterone, ApoB, HbA1c, hsCRP, and SHBG. Read them together and you get a much clearer picture of hormones, particle-driven heart risk, glucose control, background inflammation, and how much testosterone is actually usable. Read them one at a time and you can miss the plot entirely.
How to Read Bloodwork for Men Over 50 When Your Doctor’s “Normal” Label Isn’t the Full Picture
Reference ranges aren’t gold standards. They are statistical fences. In most cases, a lab reference interval captures the middle 95% of the tested population, which means it includes plenty of people with early dysfunction, subclinical disease, or plain old mediocre health. That’s not a scandal. It’s just not the same thing as optimal.
This is the first distinction that matters if you’re trying to read your own labs without getting lulled to sleep by the word “normal.” A result can land inside the lab range and still point to rising risk, slower recovery, or a trend moving the wrong way. Optimal DX makes this point directly in its discussion of inflammation markers, and Mayo Clinic’s hsCRP thresholds show how the same number can look acceptable in one frame and less reassuring in another.
Take hsCRP as an example. A value above 1.0 mg/L still sits within what many people would casually hear described as normal, but Mayo Clinic classifies under 1.0 mg/L as low cardiovascular risk, 1.0 to 3.0 mg/L as intermediate risk, and above 3.0 mg/L as high risk. Optimal DX pushes the “ideal” target lower, below 0.5 mg/L. That’s a very different conversation from “nothing to worry about.”
Call this the reference-range shrug: the moment a system designed to catch big pathology quietly stops short of helping a man who wants to keep performing well. For men over 50, that’s the whole game. You’re not only screening for disease. You’re trying to spot the early leaks before they become a flooded basement.
The practical takeaway is simple. Don’t read a blood marker as pass/fail. Read it as signal strength. Ask three questions instead: where does this sit inside the range, what outcome is it connected to, and is the trend improving or deteriorating over time? One lab value rarely tells the full story. A pattern often does.
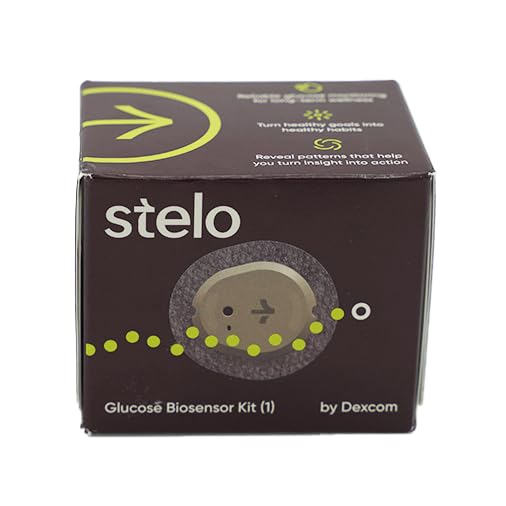
Stelo Continuous Glucose Monitor
$59.99
This article contains affiliate links. We may earn a commission at no extra cost to you.
Total Testosterone: The Most Misunderstood Number on Your Blood Panel
Total testosterone gets too much attention and not enough context. It matters, but by itself it can turn into a misleading scoreboard.
MedlinePlus lists a normal range for total testosterone in men over 50 of 193 to 740 ng/dL. That spread is enormous. A man at 210 and a man at 690 can both be stamped normal, which tells you something important about reference ranges and almost nothing about how either man feels. The American Urological Association uses 300 ng/dL as the practical threshold for low testosterone, and the HIM Study, published in the International Journal of Clinical Practice, estimated that 38.7% of men age 45 and older fall below that line.
That prevalence matters because it explains why this issue keeps showing up in executive physicals, men’s health clinics, and private conversations between friends who suddenly care a lot more about sleep quality and recovery than they did at 35. Low testosterone isn’t rare. It’s common enough that treating it like a fringe concern is silly.
But the common mistake is stopping at total T. A total testosterone result tells you how much hormone is circulating. It doesn’t tell you how much is available to tissues. That’s where SHBG enters the picture, and it’s why a “normal” total T can coexist with low drive, slower training response, weaker recovery, or the vague sense that the engine is still running but one cylinder has clocked out.
So how should you read the number? First, look at the absolute value. If you’re below 300 ng/dL, that deserves a proper discussion with your provider, especially if symptoms are present. Second, look at timing. Testosterone is usually best assessed in the morning, and one off reading doesn’t settle the matter. Third, look at the companion markers: SHBG, and if available, free testosterone. Total T is the headline. It isn’t the full article.
This is also where overconfident internet advice goes off the rails. One camp pretends every tired man needs TRT. The other waves away symptoms because the lab slipped you inside the reference band. Neither is serious. Serious interpretation means lining up the number, the symptoms, and the companion markers before deciding what the result actually means.
ApoB: The Lipid Marker That Outperforms LDL for Predicting Heart Attack Risk
If you only remember one cardiovascular marker from this article, make it ApoB. LDL cholesterol still dominates standard conversations, but LDL is measuring cholesterol mass. ApoB is measuring the number of atherogenic particles that can get into the arterial wall. For risk prediction, particle count is a cleaner signal.
Cleveland Clinic describes ApoB as the marker that counts the lipoprotein particles associated with plaque formation, including LDL, VLDL, and Lp(a)-related particles. That’s the key distinction. Two men can have the same LDL cholesterol and very different numbers of particles doing the damage. The one with more particles usually has the worse risk profile, even if the traditional panel looks tidy enough to keep everyone calm.
The thresholds are what make ApoB useful in real life. Cleveland Clinic notes that an optimal ApoB is below 80 mg/dL, and below 60 mg/dL can be appropriate for men who already carry cardiovascular risk factors. The conventional lab range can extend to 140 mg/dL. That’s a huge gap between “not flagged” and “actually where you want to be.”
The American Heart Association’s 2024 scientific statement in Circulation strengthens the case here. ApoB is increasingly treated as a better summary of atherogenic burden than LDL cholesterol alone because it captures the number of particles, not just the cholesterol cargo inside them. Think of LDL as measuring how much freight is on the highway. ApoB measures how many trucks are actually headed toward the bridge.
For a time-poor man over 50, the reading strategy is straightforward. If your LDL looks decent but your ApoB is high, don’t let the prettier number distract you. ApoB is often the sharper warning. If your ApoB is under 80 mg/dL, that is generally a more reassuring signal. If it is drifting upward over repeated tests, that matters even before it crosses a dramatic line.
This is one of the better examples of why “normal” can be too forgiving. A standard panel might tell you that nothing is on fire. ApoB tells you whether someone has been leaving oily rags near the furnace for the last few years.
HbA1c: Your 3-Month Glucose Report Card — and Why 47.6% of Men Are in the Danger Zone
HbA1c is the marker that quietly reveals whether your metabolism has been behaving itself for the last three months. It measures average blood glucose over roughly that span, which makes it more useful than a single fasting glucose result that can wobble around depending on sleep, stress, illness, or what happened the night before.
The threshold system is refreshingly clear. The CDC and the American Diabetes Association define normal as below 5.7%, prediabetes as 5.7% to 6.4%, and diabetes as 6.5% or higher. Those aren’t vague categories. They are practical lines that help you sort “watch this” from “act on this.”
The prevalence data is what should get your attention. The CDC’s National Diabetes Statistics Report estimates that 47.6% of U.S. men have prediabetes. Nearly half. For men over 50, the burden is even heavier because age-related metabolic changes, lower activity, and creeping body-composition shifts all start leaning the wrong way at once. This isn’t a niche problem for sedentary strangers. It’s mainstream.
Harvard Health’s overview of HbA1c is useful because it frames the test in plain language: this is the long-view report card, not the pop quiz. If your A1c is 5.8% or 6.1%, the lab may not make a dramatic speech. Your metabolism still is.
Interpretation here should stay concrete. Under 5.7% is the conventional green zone. Between 5.7% and 6.4% is prediabetes, and that category is big enough to hide for years behind a respectable annual checkup. At 6.5% or above, you are in diabetes territory and need medical follow-up, not podcast-level guesswork.
The reason HbA1c belongs next to ApoB and hsCRP is that these markers often travel as a group. Worsening glucose control tends to overlap with higher inflammation and a more dangerous cardiovascular picture. When men over 50 start saying, “My energy is off, my waist is up, and recovery is getting weird,” HbA1c often turns out to be part of the answer.
hsCRP: The Inflammation Marker That Connects Heart Disease, Metabolism, and Aging
High-sensitivity C-reactive protein is one of the most useful “something is simmering” markers on a modern lab panel. Standard CRP is better at spotting bigger inflammatory events. hsCRP is better at detecting the low-grade background inflammation that often shows up before anyone has a dramatic diagnosis.
Mayo Clinic’s cardiovascular risk categories are clean: below 1.0 mg/L is low risk, 1.0 to 3.0 mg/L is intermediate risk, and above 3.0 mg/L is high risk. Optimal DX argues for an even lower ideal target, under 0.5 mg/L, when the goal is performance and preventive clarity rather than just avoiding a red flag.
That matters because inflammation isn’t confined to one organ system. Elevated hsCRP has been associated with atherosclerosis, insulin resistance, and metabolic syndrome. In older men, those problems tend to converge rather than arrive one at a time. The same man with creeping ApoB and a softening HbA1c can also show an hsCRP that explains why he feels older than the calendar says he should.
There is one important caveat. If hsCRP comes back above 10 mg/L, Mayo Clinic notes that acute infection or injury becomes more likely, which means the test may be catching a cold, dental issue, hard training block, or some other temporary event rather than chronic risk. That’s why context matters. This number is useful, but it isn’t psychic.
So how should you use it? First, read it as a system-wide stress marker, not a diagnosis. Second, compare it against the rest of the panel. An hsCRP of 2.2 mg/L means more when ApoB and HbA1c are also unimpressive. Third, repeat it if the number seems out of character or if you were recently sick. Trends matter here more than theatrics.
If there’s a unifying biomarker in this group, hsCRP is a strong candidate. It often tells you that several smaller problems are starting to coordinate. That’s usually when the smart move is to pay attention, not panic.
SHBG: The Gatekeeper That Determines How Much Testosterone You Can Actually Use
SHBG is the hormone marker many men have never heard of right up until it explains half their testosterone confusion. Sex hormone-binding globulin is produced largely by the liver and binds to testosterone in circulation. Once bound, that testosterone isn’t freely available to tissues in the same way.
This is why total testosterone can look acceptable while the lived experience doesn’t. MedlinePlus explains the basic function clearly: SHBG helps determine how much sex hormone is available in active form. A man with rising SHBG can show a respectable total T and still have less bioavailable testosterone than the headline number suggests.
The age pattern matters. A longitudinal study published in the Journal of the Endocrine Society found SHBG rising by roughly 1.4% per year after age 40 in aging men. That isn’t a small detail. Over a decade, that trend can materially change how much testosterone is actually usable even if total production doesn’t collapse.
Low SHBG can matter too. The same marker is associated with insulin resistance and metabolic syndrome, which means SHBG isn’t just a testosterone sidekick. It can also be part of the metabolic picture. That makes it unusually useful because it helps connect hormonal interpretation with the glucose and inflammation markers already on the page.
Reference ranges vary by lab, often around 14 to 78 nmol/L, but a single isolated value rarely settles the whole question. The better move is to interpret SHBG alongside total testosterone and, if available, free testosterone, then watch the trend over time. Rising SHBG with middling total T can help explain symptoms that a basic panel glosses over.
This is also the section where restraint matters. A weird SHBG value isn’t a self-issued license to start tinkering with hormones. It’s a reason to ask better questions, get the companion markers, and discuss the result with a qualified provider if the picture points toward androgen deficiency or a broader metabolic issue.
Related: How to Interpret Your Own Blood Work: A Step-by-Step Guide for Men Over 50
Related: Three-Year Biomarker Trendlines
Related: The Men Over 50 Annual Lab Checklist
Frequently Asked Questions
Should I get my bloodwork done fasting or non-fasting for these five biomarkers?
HbA1c doesn’t require fasting because it reflects roughly three months of glucose exposure. ApoB is often still interpreted cleanly without fasting, but some clinicians prefer fasting when a full lipid panel is being run at the same time. Testosterone is usually best drawn in the morning because levels vary through the day. If your provider gives prep instructions, follow those first because consistency matters more than internet folklore.
How often should a man over 50 test these specific biomarkers?
That depends on baseline risk, symptoms, medication use, and whether you are tracking an active intervention. For a generally healthy man using these as monitoring markers, annual testing is common. If a number is drifting the wrong way, if symptoms suggest hormonal issues, or if treatment is being considered or adjusted, more frequent follow-up may make sense with a provider’s guidance.
Can I order my own labs for Total T, ApoB, HbA1c, hsCRP, and SHBG without a doctor’s referral?
In many states, yes, direct-to-consumer lab platforms make that possible. The convenience is real. The trap is thinking access and interpretation are the same thing. Ordering the test is easy; knowing what an ApoB of 96 plus an hsCRP of 2.4 means in the context of age, symptoms, and family risk is the harder part.
What’s more important: free testosterone or total testosterone?
Neither should be treated as a solo act. Total testosterone is the broad starting point, but free testosterone is often more reflective of what tissues can actually use, especially when SHBG is high. If symptoms and total T don’t match, that is usually the moment to ask for the fuller hormonal picture rather than pretending one number settled it.
If my hsCRP is over 3 mg/L, what should I do next before assuming it’s cardiovascular?
Rule out the obvious temporary explanations first: recent infection, injury, dental inflammation, or a punishing training week. Mayo Clinic notes that values above 10 mg/L often point toward an acute process rather than chronic cardiovascular risk. If the elevation persists on repeat testing, then it becomes much more useful to interpret alongside ApoB, HbA1c, symptoms, and your broader risk profile.
The better way to read bloodwork for men over 50 is to stop treating each line item like a separate pop quiz. Total T, ApoB, HbA1c, hsCRP, and SHBG work best as a group. Read them together, watch the trend, and you move from “the lab says normal” to a much more useful question: what is this panel trying to tell me about how I will feel and perform over the next five years?
Continue reading: Read the pillar — Biomarkers & Lab Testing
This article is for informational purposes only and is not financial advice. Consult a qualified professional for personalized guidance.
Leave a Reply